Mynd:WeierstrassFunction.svg

Stærð þessarar PNG forskoðunar á SVG skránni: 795 × 505 mynddílar. Aðrar upplausnir: 320 × 203 mynddílar | 640 × 407 mynddílar | 1.024 × 650 mynddílar | 1.280 × 813 mynddílar | 2.560 × 1.626 mynddílar.
Upphafleg skrá (SVG-skrá, að nafni til 795 × 505 mynddílar, skráarstærð: 120 KB)
Lýsing
| Lýsing |
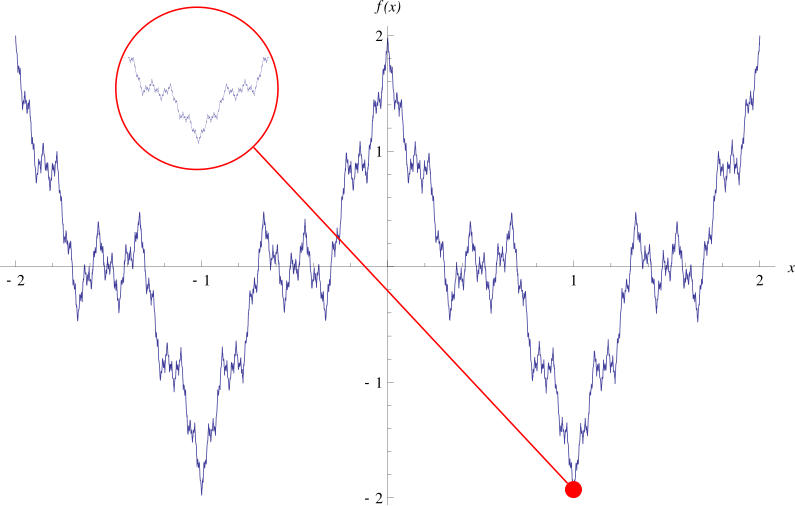
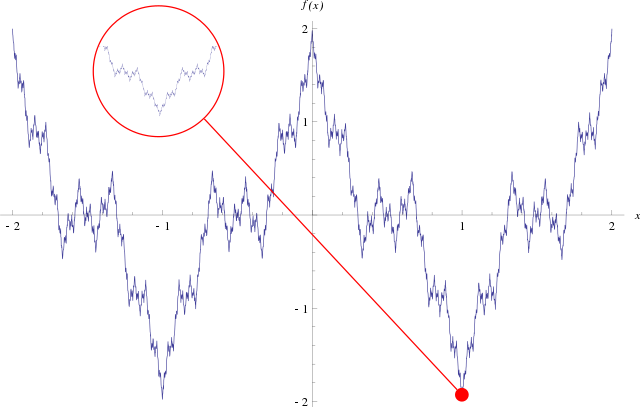
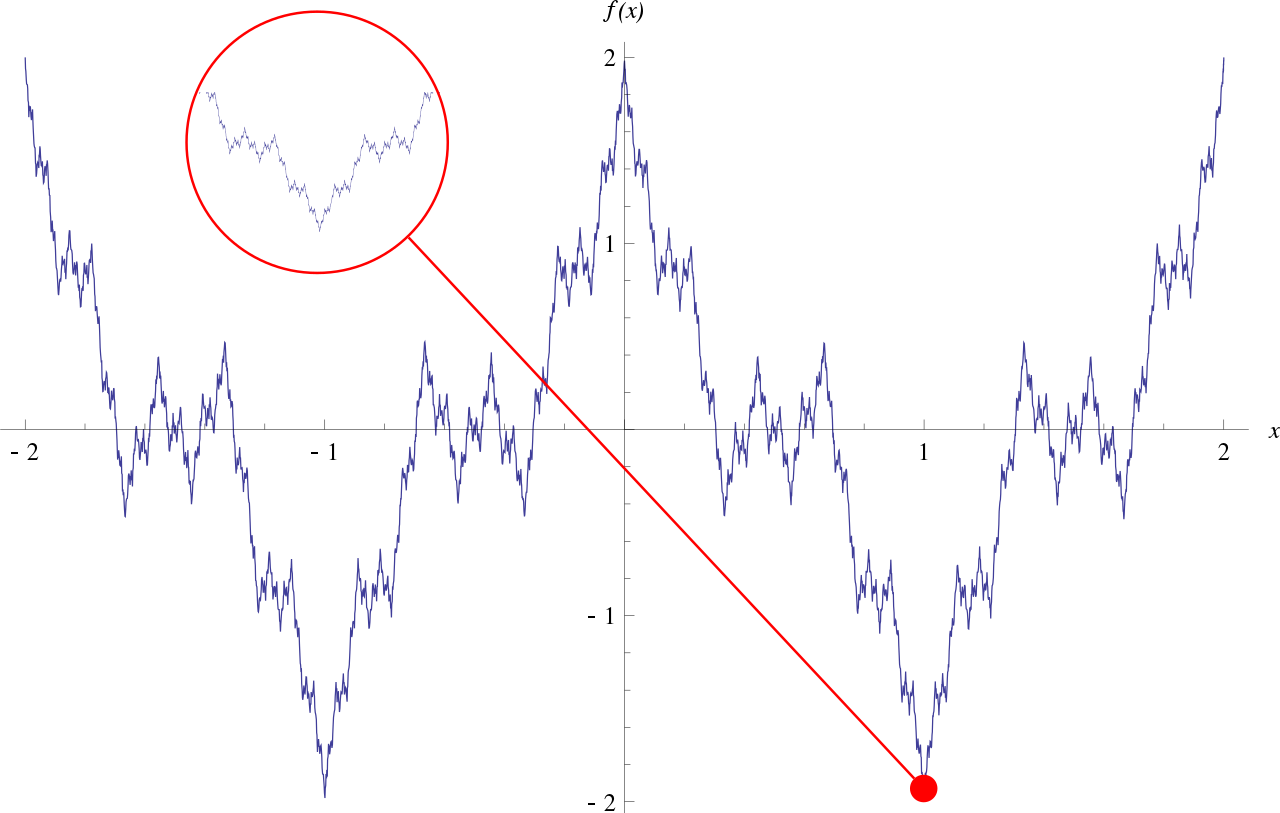
English: Plot of the Weierstrass function. A section of the plot is zoomed in on to illustrate the fractal nature of the function. The plot was generated using Mathematica and exported to SVG. I first made a plot of the region and then a plot of a much smaller section around the red point on the image. With the use of Inkscape, I was able to put the two in the same SVG file. This file is an Inkscape SVG, not a plain SVG. |
| Dagsetning | |
| Uppruni | eigin skrá |
| Höfundarréttarhafi | Eeyore22 |
| Aðrar útgáfur | File:Weierstrass_function.gif |
W3C-validity not checked.
Leyfisupplýsingar:
| I, the copyright holder of this work, release this work into the public domain. This applies worldwide. In some countries this may not be legally possible; if so: I grant anyone the right to use this work for any purpose, without any conditions, unless such conditions are required by law. |
Breytingaskrá skjals
Smelltu á dagsetningu eða tímasetningu til að sjá hvernig hún leit þá út.
| Dagsetning/Tími | Smámynd | Víddir | Notandi | Athugasemd | |
|---|---|---|---|---|---|
| núverandi | 27. október 2008 kl. 00:44 | | 795 × 505 (120 KB) | Eeyore22~commonswiki | {{Information |Description={{en|1=Plot of the Weierstrass function. A section of the plot is zoomed in on to illustrate the fractal nature of the function.}} |Source=Own work by uploader |Author=Eeyore22 |Date=October 26, 2008 |Permissio |
Skráartenglar
Eftirfarandi síða notar þessa skrá:
Altæk notkun skráar
Eftirfarandi wikar nota einnig þessa skrá:
- Notkun á ar.wikipedia.org
- Notkun á bg.wikipedia.org
- Notkun á ca.wikipedia.org
- Notkun á cs.wikipedia.org
- Notkun á cv.wikipedia.org
- Notkun á de.wikipedia.org
- Notkun á de.wikiversity.org
- Kurs:Mathematik für Anwender (Osnabrück 2011-2012)/Teil I/Vorlesung 15
- Kurs:Mathematik für Anwender (Osnabrück 2011-2012)/Teil I/Vorlesung 15/kontrolle
- Kurs:Analysis (Osnabrück 2013-2015)/Teil I/Vorlesung 12
- Kurs:Analysis (Osnabrück 2014-2016)/Teil I/Vorlesung 12
- Kurs:Analysis (Osnabrück 2014-2016)/Teil I/Vorlesung 12/kontrolle
- Kurs:Grundkurs Mathematik (Osnabrück 2016-2017)/Teil II/Vorlesung 51
- Kurs:Grundkurs Mathematik (Osnabrück 2016-2017)/Teil II/Vorlesung 51/kontrolle
- Kurs:Grundkurs Mathematik (Osnabrück 2018-2019)/Teil II/Vorlesung 51
- Kurs:Grundkurs Mathematik (Osnabrück 2018-2019)/Teil II/Vorlesung 51/kontrolle
- Kurs:Mathematik für Anwender (Osnabrück 2019-2020)/Teil I/Vorlesung 10
- Kurs:Mathematik für Anwender (Osnabrück 2019-2020)/Teil I/Vorlesung 10/kontrolle
- Kurs:Mathematik für Anwender (Osnabrück 2019-2020)/Teil I/Repetitorium/Vorlesung 10
- Kurs:Mathematik für Anwender (Osnabrück 2020-2021)/Teil I/Vorlesung 10
- Kurs:Mathematik für Anwender (Osnabrück 2020-2021)/Teil I/Vorlesung 10/kontrolle
- Kurs:Analysis (Osnabrück 2021-2023)/Teil I/Vorlesung 12
- Stetige Funktion/K/Motivation/Einführung/Textabschnitt
- Kurs:Analysis (Osnabrück 2021-2023)/Teil I/Vorlesung 12/kontrolle
- Kurs:Grundkurs Mathematik (Osnabrück 2022-2023)/Teil II/Vorlesung 51
- Kurs:Grundkurs Mathematik (Osnabrück 2022-2023)/Teil II/Vorlesung 51/kontrolle
- Kurs:Analysis (Osnabrück 2013-2015)/Teil I/Vorlesung 12/kontrolle
- Reelle Zahlen/Stetige Funktionen/Motivation/Einführung/Textabschnitt
- Kurs:Maßtheorie auf topologischen Räumen/Differenzierbarkeit in Analysis und Funktiontheorie
- Reelle Funktionen/Stetig/Einführung/Textabschnitt
- Kurs:Mathematik für Anwender (Osnabrück 2023-2024)/Teil I/Vorlesung 10
- Kurs:Mathematik für Anwender (Osnabrück 2023-2024)/Teil I/Vorlesung 10/kontrolle
- Notkun á el.wikipedia.org
- Notkun á en.wikipedia.org
- Notkun á en.wikibooks.org
- Notkun á en.wikiversity.org
- Real numbers/Continuous functions/Motivation/Introduction/Section
- Mathematics for Applied Sciences (Osnabrück 2023-2024)/Part I/Lecture 10
- Mathematics for Applied Sciences (Osnabrück 2023-2024)/Part I/Lecture 10/latex
- Mathematics for Applied Sciences (Osnabrück 2023-2024)/Part I/Lecture 10/refcontrol
- Notkun á en.wiktionary.org
- Notkun á es.wikipedia.org
- Notkun á et.wikipedia.org
- Notkun á eu.wikipedia.org
- Notkun á fa.wikipedia.org
- Notkun á fr.wikipedia.org
Skoða frekari altæka notkun þessarar skráar.